

Colour Management - Part Nineteen
Kiran Prayagi, print technologist and chairman, Graphic Art Technology & Education demystifies colour management in a series of articles. In this nineteenth article, he discussed CIE Systems.
17 Sep 2013 | By Kiran Prayagi

Kiran Prayagi, print technologist and chairman, Graphic Art Technology & Education
Last article 18 was introduction to CIE Colorimetry and how CIE colour circle was developed
based on human colour perception. See figure 1.
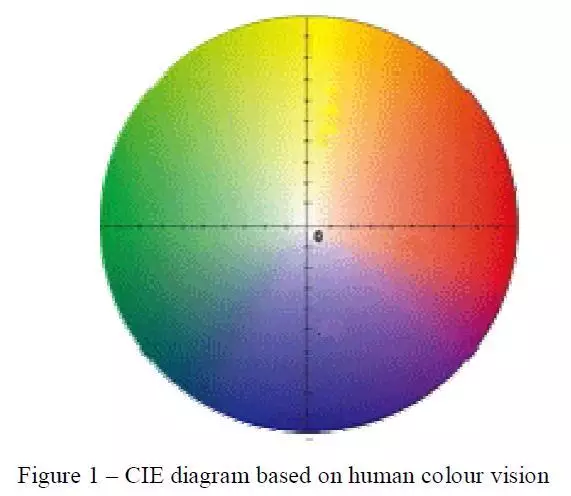
Colours are potted on diagram in figure 1 and are described in terms CIELab or CIELch. These two terms are expressing same colour in different parameters. Just as distance can be measured in inches or centimetres. CIELab uses Cartesian co-ordinates to calculate colour in a colour space whereas CIELch uses polar co-ordinates.
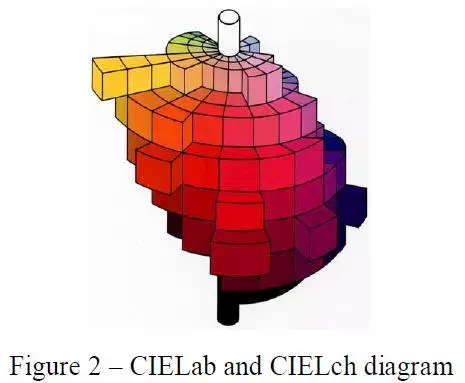
CIELab and CIELch both describes ‘L’ value based on luminous scale where light colours are at the top and dark colours are at the bottom. The scale is marked with ascending values from 0 to 100. 0 being the darkest and 100 being the lightest. See figure 2.
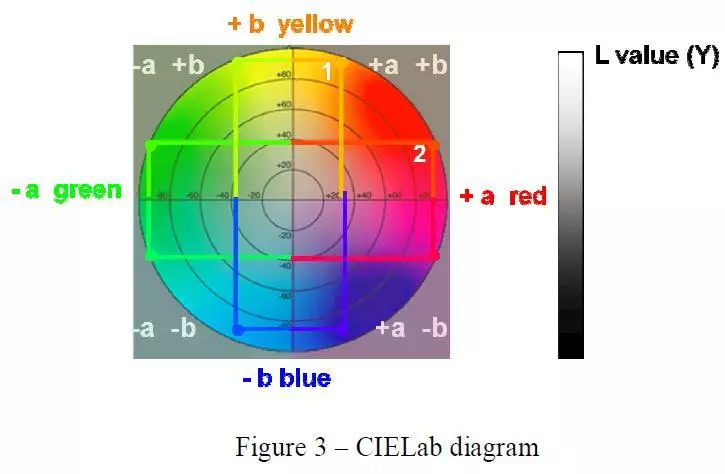
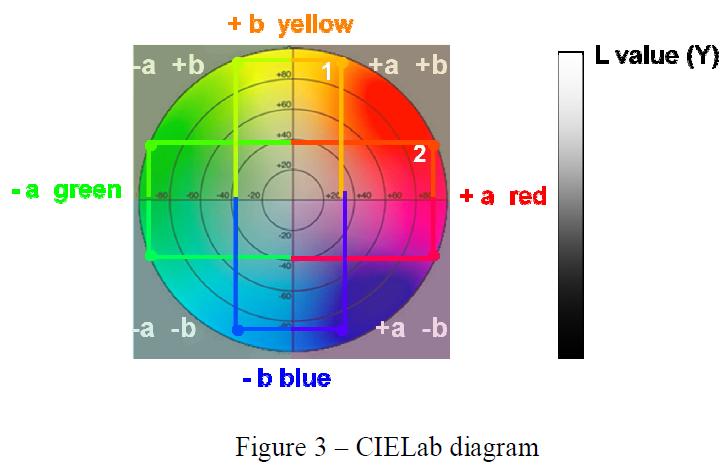
CIELab ‘a’ value describes the red-green axis. See figure 3. The centre of the circle is marked as ‘0’ and horizontal line passing through is called ‘a’ axis. Right of the centre is termed as ‘+a’ and left of the centre is termed as ‘-a’. ‘+a’ area is red region and ‘-a’ region is green area. Higher the value of ‘a’ in any direction the more saturated is the colour.
CIELab ‘b’ value describes the yellow-blue axis. See figure 3. The centre of the circle is marked as ‘0’ and vertical line passing through is called ‘b’ axis. Upper of the centre is termed as ‘+b’ and lower of the centre is termed as ‘-b’. ‘+b’ area is yellow region and ‘-b’ region is blue area. Higher the value of ‘b’ in any direction the more saturated is the colour. Thus colours falling in the red-yellow area are designated as ‘+a +b’, green-yellow area as ‘-a +b’, green-blue area as ‘-a -b’, and red-blue area as ‘+a –b’.
Device dependent systems are RGB in grey levels on colour monitors or CMYK in dot percentages in printing that do not give information on how colour will appear to human eye nor it can be converted from RGB to CMYK or vice versa.
There are many reasons why the appearance of a colour is difficult to express in device dependent system and this is where device independent system helps. Communication in colour has problems similar to those of communication in languages. Each device is like a person, speaking own language. Even the same language has different dialects. The result is a breakdown in communication and misinterpreted messages. What’s needed is an interpreter capable of interpreting the language as well as the dialect, to ensure that the message is properly communicated. This function performed by CIELab and CIELch systems.
CIELab and CIELch both describes ‘L’ value based on luminous scale where light colours are at the top and dark colours are at the bottom. The scale is marked with ascending values from 0 to 100. 0 being the darkest and 100 being the lightest. See figure 2.
CIELab ‘a’ value describes the red-green axis. See figure 3. The centre of the circle is marked as ‘0’ and horizontal line passing through is called ‘a’ axis. Right of the centre is termed as ‘+a’ and left of the centre is termed as ‘-a’. ‘+a’ area is red region and ‘-a’ region is green area. Higher the value of ‘a’ in any direction the more saturated is the colour.
CIELab ‘b’ value describes the yellow-blue axis. See figure 3. The centre of the circle is marked as ‘0’ and vertical line passing through is called ‘b’ axis. Upper of the centre is termed as ‘+b’ and lower of the centre is termed as ‘-b’. ‘+b’ area is yellow region and ‘-b’ region is blue area. Higher the value of ‘b’ in any direction the more saturated is the colour. Thus colours falling in the red-yellow area are designated as ‘+a +b’, green-yellow area as ‘-a +b’, green-blue area as ‘-a -b’, and red-blue area as ‘+a –b’.

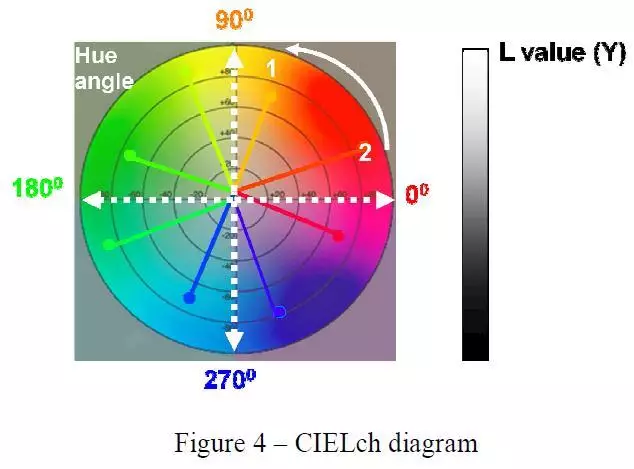
CIELch ‘c’ value describes the saturation of any colour. See figure 4. The centre of the circle is marked as ‘0’ and further away the colour lies from the centre the higher value it has and more saturated the colour is in any direction. Term chroma is synonymous to saturation and hence the letter ‘c’.
CIELch ‘h’ value describes the hue, i. e. colour, whether red, yellow, green, or blue or any other. See figure 4. The horizontal line on extreme right is taken as ‘00’ angle and follows the periphery anti-clockwise until comes back to ‘00’ or the same as ‘3600’. While following the periphery it passes the various colours or hues and, therefore, the angle becomes an indication of colour hence the hue angle indicated by letter ‘h’.
Since these diagrams are based on human colour vision colour reproduction by any systems, whether photography, printing, textile, plastics, television, or lighting industry can be
expressed by CIELab or CIELch and plotted on these diagrams. Therefore, this is called device independent system.
Device dependent systems are RGB in grey levels on colour monitors or CMYK in dot percentages in printing that do not give information on how colour will appear to human eye nor it can be converted from RGB to CMYK or vice versa.
There are many reasons why the appearance of a colour is difficult to express in device dependent system and this is where device independent system helps. Communication in colour has problems similar to those of communication in languages. Each device is like a person, speaking own language. Even the same language has different dialects. The result is a breakdown in communication and misinterpreted messages. What’s needed is an interpreter capable of interpreting the language as well as the dialect, to ensure that the message is properly communicated. This function performed by CIELab and CIELch systems.


 See All